Archive for the ‘MBA’ Category
Fixing OneDrive annoyance with Rstudio on Windows
By default, Rstudio on Windows with OneDrive installed stores packages in the OneDrive documents folder. This package location causes a lot of issues:
- It causes a lot of upload to OneDrive
- It can cause conflicts between machines (since they will be storing to the same OneDrive folder)
- It can cause unnecessary delays in having to download files from OneDrive (if they are not locally cached)
All in all, this location seems to be a poor side-effect of making OneDrive the default storage location on Windows. It can be easily rectified. Simply create a file called .Renvironment in “C:\Users\<username>\OneDrive\Documents” (AKA your OneDrive documents folder) with the following line:
R_USER="C:/User/<username>"
This one line redefines the user-specific directory to be on the local disk, in C:\Users\<username>. This is the exact same place as the %USERPROFILE% environment variable on Windows. The site-wide .Rprofile will make use of this variable and create an package path using it as a base.
These mechanisms are explained here, and it is simpler than editing the site-wide .Rprofile as described here (and many other places), which would require you to repeat the procedure on new installations (and also requires modifying files in the base installation path).
Causation, Correlation, and Instrumentation
One confounding problem in statistics (and life) is distinguishing causation and correlation. Let’s say we can observe two things simultaneously: X and Y. We collect many such observations. We notice that X and Y always move together. When X goes up, Y goes up (and vice versa). When Y goes down, X goes down (and vice versa). We would like to say that X causes Y. That is, we would like to draw a graph as follows, where the arrow indicate the direction of impact: X causes Y.

However, we can’t make that statement (at least not based on these observations) for a few different reasons.
Reverse Causation
The first is that we only know X and Y move together. It could be that Y in fact causes X. An example would be an alien observing human behavior. The alien notices that days that humans have umbrellas tend to be rainy days. The alien concludes that umbrellas cause rain. Instead of the model of X causing Y, our model is that Y causes X:

Fundamentally, the problem here is Y and X are just things we can observe. We don’t really know which is Y and which is X. Does social media cause anxiety/depression, or are depressed/anxious people more likely to go on social media?
Hidden Variable
It could also be the case that X and Y both depend on another variable V that we can’t see. Here is an example:
Do churches cause murder? In the 1980s several studies used census data to show that the more churches a city has, the more murders occur in the city each year. With tongue in cheek, the authors claimed to have proved that the presence of churches increases the prevalence of murders. While the data were correct, the conclusion was obviously nonsense. What is the hidden variable here? Larger cities tend to have more of everything, including both churches and murders, so the hidden variable is population size.
Stuart Math – Discovery Project: Causation and Correlation
We have the model below:

In this case, X does not cause Y. And Y does not cause X. V causes both of them. What’s worse, we can never be sure that one or more such variables exist.
Overall Confounding Model
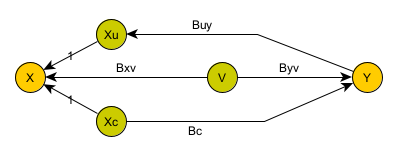
Putting it all together, we get a model where we can only observe X & Y. X can cause Y and/or Y can cause X (possibly simultaneously). In addition, both X and Y could depend on another variable which we cannot see.

To make things clear, I split out X into two terms: Xc (which does cause Y) and Xu (which is caused by Y). We do not have access to Xu and Xc: they both contribute to X (which we can observe). (In fact, they really don’t exist: they are just a convenient way of splitting X up into two contributors.)
By definition, the hidden variable V is a root cause: it does not depend on anything else,
but both observations (X & Y) depend on it.
What we are after is the term Bc: that tells us what portion of Y depends on X.
Instrumentation
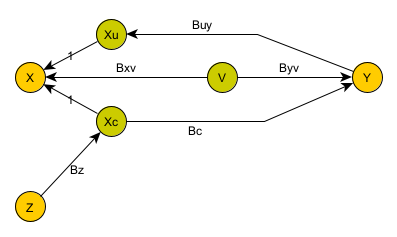
To do so, we are basically going to cheat: we are going to try to find another variable Z which we can observe.
This variable needs to be unrelated to Y. That is, there can be no direct relationship between Y and Z. Other than through X (Xc in this model), Y and Z cannot have any dependencies on each other. In fact, we cannot just judge this by looking at statistics. We need a non-statistical reason for this to be the case.
Our model now looks as follows:

The key here is that we have found a miracle variable Z. We know (through some other argument) that Y does not depend on Z.
What if (hypothetically) V depends on Z? Well, it can’t. By definition, a hidden variable cannot depend on another observable variable in the system.
By correlating/regressing X to Z, we can get Bz. Then, by correlating Y to X (or really an estimate of X synthesized from Z), we can get Bc.
Motivation
I really wanted to just draw the diagrams of all these different effects without introducing math. I came across all these ideas in a statistics class last week, and I could not keep an understanding in my mind without a picture. Once I had the pictures, I felt the concepts were much easier to understand.